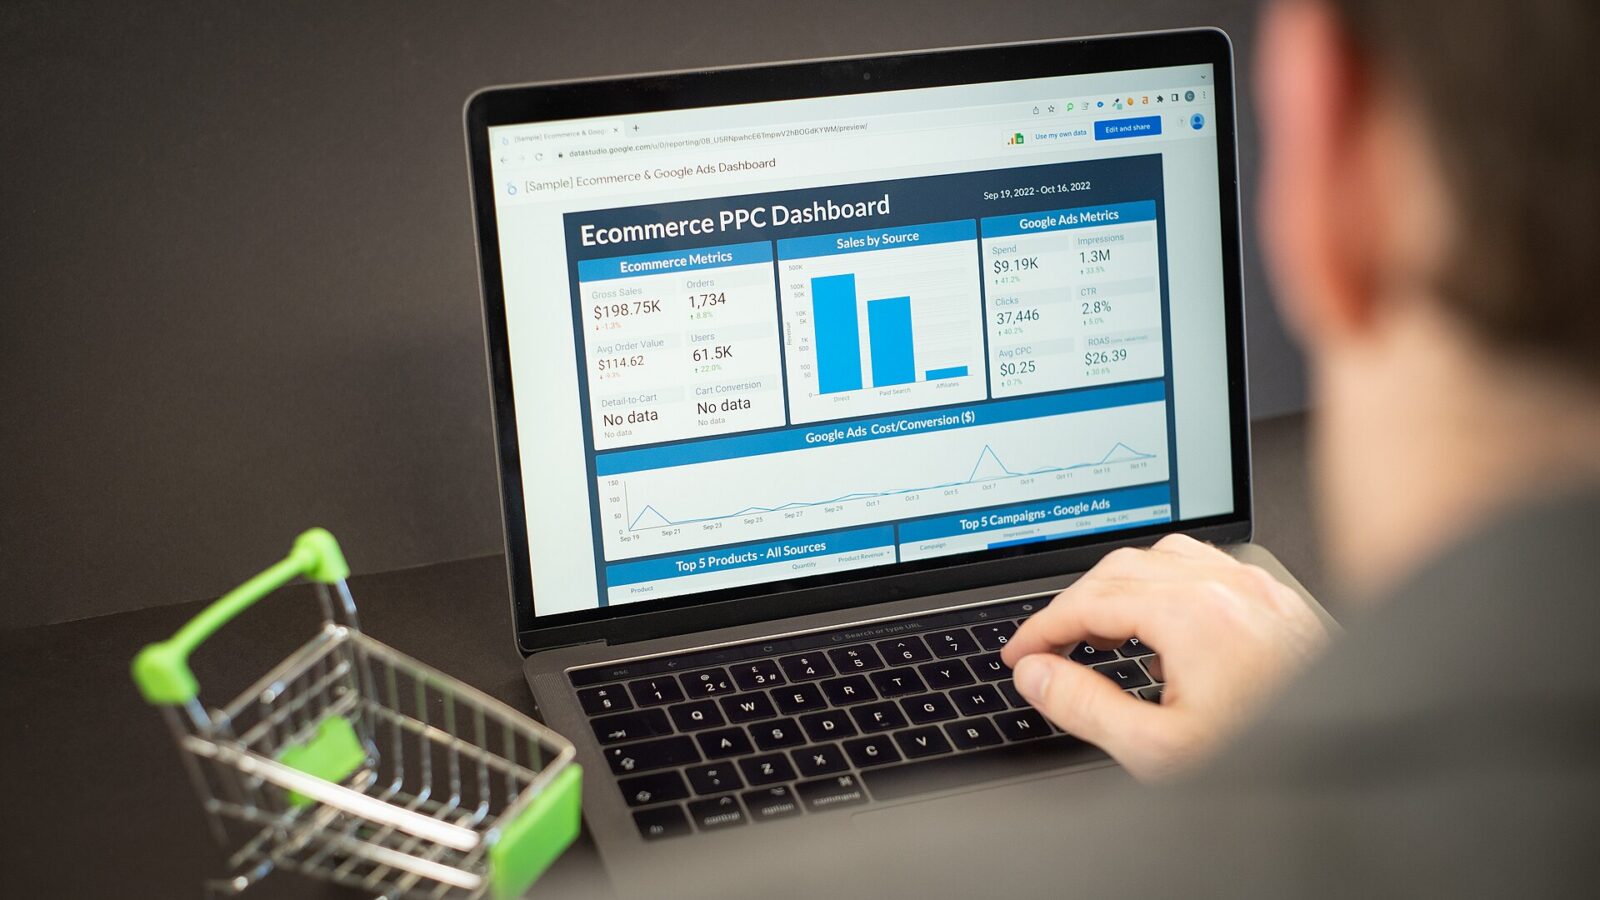
Data analysts turn raw data into answers: which products sell best, where costs are rising, why customers leave. Many businesses need these skills, and graduates from commerce, science, engineering and other backgrounds move into the role.
What the job involves
- Collecting and cleaning data from spreadsheets, databases or tools.
- Analysing it to answer business questions.
- Presenting findings in reports and dashboards.
- Explaining results clearly to non-technical colleagues.
Core skills
- Excel or Google Sheets — pivot tables, lookups, charts (see Excel skills for office jobs).
- SQL — to pull data from databases; asked for in most analyst job descriptions.
- A visualisation tool such as Power BI or Tableau.
- Basic statistics — averages, distributions, correlation.
- Python or R — useful, and increasingly expected for more senior roles.
- Communication — the difference between a good and great analyst.
A realistic path
- Learn spreadsheets thoroughly first.
- Learn SQL basics and practise on free sample databases.
- Learn one visualisation tool.
- Build 2–3 projects using public data sets, each answering a clear question.
- Publish them (e.g. on GitHub or a portfolio page) and describe them on your resume.
First roles to look for
Job titles vary: data analyst, MIS executive, business analyst (junior), reporting analyst or operations analyst. MIS and reporting roles are a common entry point, especially for commerce graduates.
A word of caution
Be wary of courses that promise guaranteed placement or salaries. Check what is actually taught, speak to past students if possible, and remember that your projects and skills — not a certificate alone — get you hired.